This blog will describe briefly regarding one of the most practically efficient methods to improve the efficiency of solar PV by cooling. (Do check out the last blog which listed various cooling techniques for an overall idea about the context).
Passive cooling by water is one of the most preferred techniques for cooling of solar PV as it involves the surface contact of the heated PV panel and the flowing water used for cooling. This method can be used passively by the potential head differences based on water supply apparatus. The setup of such a system can vary based on factors like space available, water supply, placement of solar PV and fixtures of apparatus.
Our team at L.D.R.P college of Engineering and Research have conducted a study for noting down the readings based on temperature differences, proportionality of heat and charging of solar battery, and different ratings of power output and voltage difference with the cooling technology. We have also concluded the results we obtained from use of this cooling technique which will be further discussed in this blog. Below is the representation of our setup.
 |
| Fig. Passive water cooling system setup for Solar PV panel |
The water streams are circulated by simply piercing the pores in the PVC water tube. These holes are about 2 mm in diameter. The water in the tube can be circulated passively using the potential head and it can flow on inclined PV panels.
The observation table below is for this particular PV panel in connection with a solar battery.
Furthermore, our team also compiled the average readings of power outputs with and without using this water cooling technique as illustrated in the table below.
Table 2. Power output and difference in average power output with cooling and without cooling condition of PV panel with reference to temperature and time throughout the day
Also note that these temperature readings were taken in Gandhinagar city of Gujarat, India on a summer day in the month of April. We also noted the results and some noteworthy points that can be used for further research and application of this cooling setup.
Results and Discussion:
Passive water cooling technique was proven very efficient as it does not use any power source but functions on purely the principles of potential head applied to cooling water.
This system can not only generate more power for the desalination unit and its backup charge for battery but also, it is very effective for the preservation of Solar cells` life extent to a few years by decreasing the degradation of semiconductor materials in the PV cells.
The setup was completed creating a power source for the constant working and providing enough backup for working of the RO unit (connected as load to Solar PV panel to obtain real time results), and inverter circuit and its internal cooling component like the inverter fan. The charging rate results and the brief comparison of the power output with and without cooling conditions are graphically represented here:
 |
| Fig. Graphical representation of charging rate of Solar battery |
Input of PV panel is observed to be around 39VDC at 7.5A approximately in open circuit condition which is controlled by the charge controller at 20 VDC 5A to charge the battery with a reasonable potential difference. The battery can charge upto 13.9VDC at no load condition and at 13.7VDC in loaded condition which has been measured experimentally and also stated in its specifications by the manufacturer. This graph represents the charging of a 26Ah Solar battery.
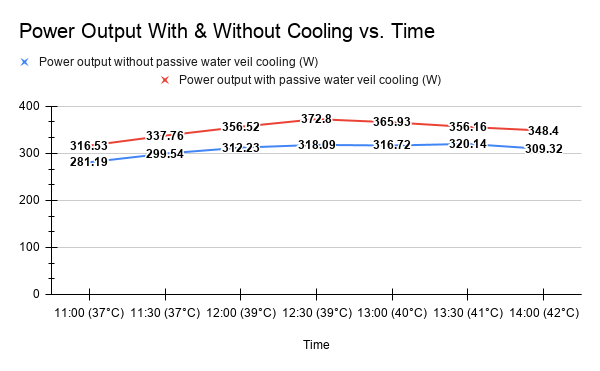 |
| Graphical representation of Power output with and without cooling conditions and its comparison: |
It can be calculated from the above graphical results;
1, The average power output without the cooling condition = 308.17 W.
2. The average power output with the cooling condition = 350.58 W
Therefore the percentage(%) increase in the average power output with the cooling condition can be calculated as;
Pinc. = [(350.58-308.17)/308.17] *100
Pinc = 13.76%
Therefore, the increase in power with the passive water cooling compared to no cooling condition is 13.76%
Comments
Post a Comment